Category: Stock Markets

  • The Share That Was Supposed to End

    The Share That Was Supposed to End

    For the first hundred years or so of organised trade finance, a share wasn't really what we'd recognise today. You didn't buy into a company and then own a sliver of it forever, watching a number tick up and down on a screen. You bought into a voyage instead. The merchants of Tudor England would pool their money, load a ship, send it off to Muscovy or the Spice Islands. And then – when it came back, if it came back – they'd divide everything up and go home. Done. Finished. You got your share of the proceeds, the whole enterprise wound itself up, and that was that.

    Broken sharing agreement between two people — detail

    That model had a name: the terminable joint stock. And it made a kind of honest, human sense.

    The Money Had an End Date

    The beauty of the terminable venture was that the exit was built in from the start. You weren't signing up to own a floating number for the next thirty years, hoping someone else would eventually want to buy it off you. You were financing a specific thing – a ship to Persia, a fur-trading expedition, a venture to find a north-east passage – and once that thing concluded, the accounts were settled and the capital returned. Shareholders didn't need a stock market, because they didn't need to sell their stake to anyone. They just waited for the journey to end.

    Some of the Scottish deed of co-partnery arrangements worked the same way: a defined partnership for a defined purpose, with a defined wind-up. The whole structure assumed something pretty basic – that money lent to a venture should, at some point, come back.

    How did the East India Company change share ownership?

    The East India Company started out running terminable voyages in exactly this way. But somewhere in the early 1600s, the directors worked something out. If they kept rolling the capital over into the next venture rather than dissolving it – if they made the arrangement permanent rather than voyage-by-voyage – they'd never actually have to give the money back. Investors who wanted out would have to find someone else to sell to. And so the permanent, tradeable share was born: not because it was better for investors, but because it was enormously more convenient for the people running the company.

    For more reading on the strange economics behind how we spend and invest, visit The Only Honest Review of a Luxury Holiday Comes From Someone Who Can't Read: https://savingourplanet.co.uk/the-only-honest-review-of-a-luxury-holiday-comes-from-someone-who-can-t-read/

    What We Quietly Lost

    Once shares became permanent and tradeable, their price stopped being about the venture and started being about what the next buyer might pay. The value drifted free from the underlying thing. That's still more or less where we are now: a share price is, in large part, a collective guess about collective guesses. Which is interesting and occasionally thrilling, but it's a long way from a group of merchants watching a ship come into harbour and splitting the proceeds on the dock.

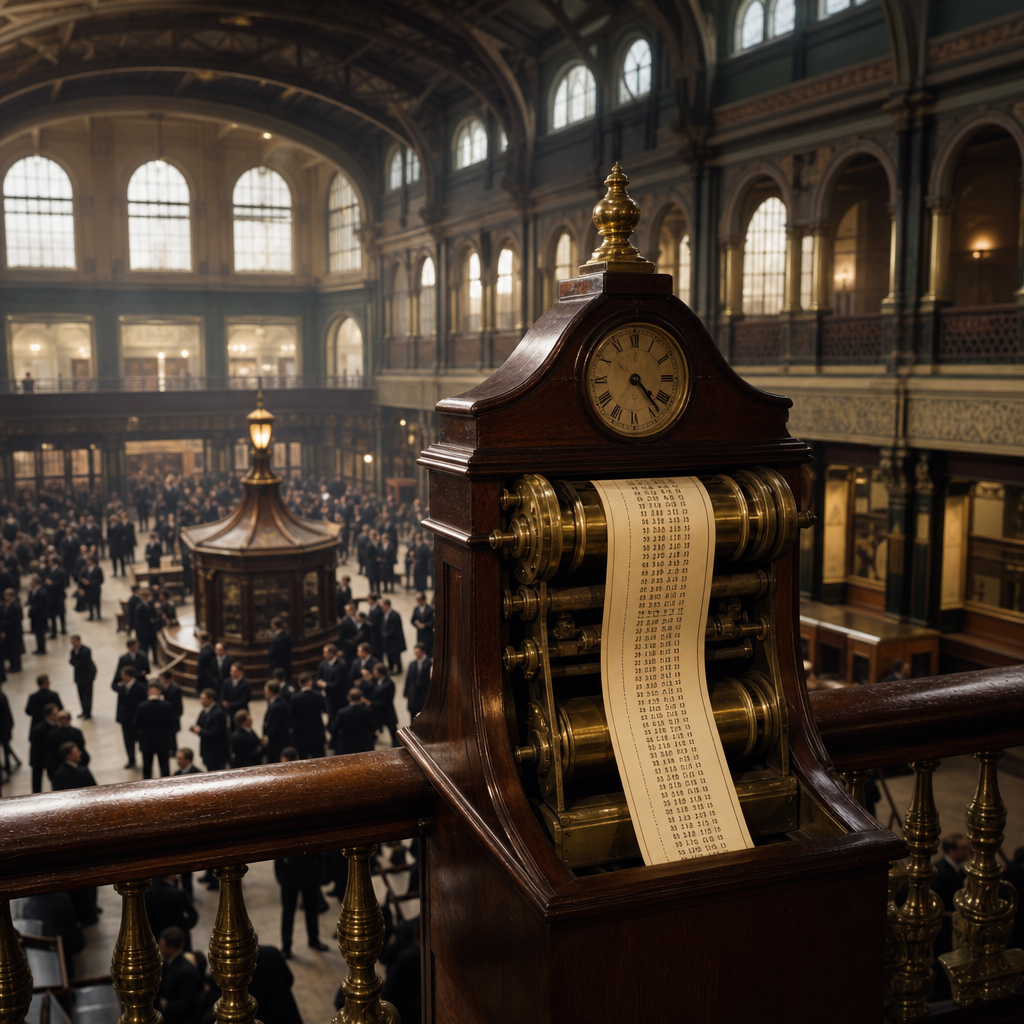
    The terminable model didn't survive because permanent capital was more useful to the people who held it. It survives only if you squint – if you look at things like fixed-term investment trusts, or the private equity fund structure, where money goes in, does something specific, and eventually comes out again. A faint echo of the Tudor merchant standing at the dockside, waiting for his ship.

    Read next

    Questions this raises

    • When did shares stop being wound up after each voyage?
    • Why do shares have no end date now?
    • What happens to shareholders when a company is wound up?

  • The Town Inside the Ticker

    The Town Inside the Ticker

    Somewhere in the Midlands right now, a warehouse supervisor is deciding whether to pick up an extra shift. In a retail park outside Swindon, a store manager is looking at Saturday's footfall figures and wondering whether to cut two part-time hours from next week's rota. In a new-build estate in Doncaster, a couple have just decided that, actually, they'll hold off on the new sofa. None of these people are thinking about stock markets. But the stock market is, in a funny way, thinking about them.

    A share price looks like a single, clean number. But it is really a kind of averaged-out town, assembled in real time from thousands of little economic signals happening all over the country. And the person sitting inside it – probably without knowing – is often the ordinary worker going about their ordinary day.

    Miniature town inside giant ticker tape — detail

    The Overnight Worker Who's Already in the Data

    While you were asleep last night, someone was sewing. Not down the road, not in a local workshop you could visit, but in a vast logistics operation running night shifts to keep a retailer's supply chain moving. That worker's wage, their contracted hours, the likelihood they'll buy a coffee on the way home – all of it feeds upward. Wage bills affect company margins, margins affect profits, and profits affect what investors think a share is worth. For more on what that night shift actually looks like in practice, see https://savingourplanet.co.uk/while-you-were-asleep-last-night-someone-was-sewing-not-down-the-road-not-in/

    The point is this: the share price of a major retailer or logistics company is not set in a vacuum by people in suits on trading floors. It is fed by the lived economic reality of the people who work for it, near it, and spend money at it – which is why it shifts.

    How does everyday spending end up in a share price?

    Here is the odd bit. A share price is national, sometimes global, and yet the inputs are intensely local. Employment rates in the North East, consumer confidence in the commuter belt, how quickly new builds are selling in Bristol – all of this trickles into the health of the companies that depend on those places. A supermarket group's share price quietly reflects whether people in Aberdeen feel flush enough to buy branded goods this week, or whether they've switched to own-label. It reflects the Coventry factory that's just gone onto a three-day week, because those workers will spend differently.

    The market aggregates all of it into a single blinking number, which is why analysts obsess over regional employment data and retail footfall reports that most people barely notice.

    What the Price Is Saying

    So when a share price moves, it's worth asking: moved because of what? Often it's because some real, ground-level thing shifted. A company lowered its profit forecast because discretionary spending fell in the North West, or a housebuilder's shares dipped because planning permissions in the South East slowed. The abstraction of "the markets" tends to make people think it's all happening somewhere else, in a financial world separate from real life. It isn't. It's a translation of real life, with all the messiness that involves, compressed into a number that updates by the second.

    The warehouse supervisor choosing whether to take that extra shift? They're in there too.

    Questions this raises

    • Why do markets move before the economy does?
    • Is the FTSE a fair guide to the UK economy?
    • What data do analysts use to forecast retail earnings?
  • The Traffic Light System That Left Eight Per Cent of Men in the Dark

    The Traffic Light System That Left Eight Per Cent of Men in the Dark

    Open any stock market app right now and the first thing you see is a Christmas tree of numbers. Green ones climbing. Red ones falling. The whole thing twitches and pulses like a living thing, and in about a second and a half your eye has scanned the entire portfolio and told your brain whether today is a good day or a bad one. That speed is the point. The colour is doing work that the numbers alone, at a glance, simply cannot.

    What the Colours Are Actually Encoding

    Red and green on a market screen are not decoration. They are a compressed language. Green means the price is higher than it was at the start of the trading session; red means it's lower. That's genuinely it. But folded into that simple binary is an enormous assumption: that you can see the difference between the two.

    Color blindness traffic light confusion illustration — detail

    Roughly 8% of men in the UK have some form of red-green colour vision deficiency. Not full colour blindness, which is vanishingly rare, but the more common deuteranopia or protanopia – where the eye's ability to distinguish red from green is reduced to degrees of muddy brown and grey. For those people, a Bloomberg terminal or an investment app is not a dashboard. It's a fog.

    Why do stock apps still use red and green together?

    The red-and-green system wasn't handed down from on high. It drifted in from ticker tape culture, from the physical world of stock exchange floors where clerks used coloured chalk to mark prices up or down on chalkboards. Green for growth, red for danger – both deeply embedded in Western visual culture long before anyone was charting equities. By the time screens arrived, the shorthand was so baked in that nobody thought to question it. It simply became the default, and defaults tend to stay defaults because changing them inconveniences the majority.

    Financial data platforms have been extraordinarily slow to respond. Some now offer alternative colour schemes – blue and yellow is one common substitute that most colour-blind users can read cleanly. But it's usually buried in accessibility settings, if it exists at all. Most apps don't mention it at the account creation stage. You have to know to look.

    For more on how design assumptions quietly exclude people, see The Seam That Isn't There.

    What the Market Assumes About You

    This is where it gets interesting. Financial markets present themselves as pure information – numbers, percentages, ratios, the cold logic of price. But the way that information is packaged is full of assumptions about a particular kind of body reading it. Assumptions about sight. About the speed of a glance. About what "intuitive" means.

    The red-green convention is just the most visible example. It tells you something about who the system was designed for and who was an afterthought. The data exists. Whether you can see it is a different question entirely, and for a surprisingly large number of people, the answer has always quietly been no.

    Questions this raises

    • How do colour blind investors read a market screen?
    • Is there a way to change the colours in trading apps?
    • Does red mean falling on every country's stock market?
  • The Yard Full of Animals and the Half-Loaded Ship

    The Yard Full of Animals and the Half-Loaded Ship

    The stock market has a reputation for being abstract, intimidating, and belonging to people who wear lanyards at conferences. But if you look at the words themselves rather than the numbers, it turns out to be none of those things. Strip away two centuries of financial polish and what you find underneath is a farmyard, a dockside, and a fairly disreputable corner of London where people watched animals tear each other apart.

    Why is a share still called a stock?

    "Stock" is the oldest word in this story. Long before it meant a portfolio or a ticker symbol, it meant livestock – cattle, sheep, pigs. A farmer's stock was his countable, tangible wealth, the animals standing in the yard that he could point at and say, this is what I have. When merchants began pooling resources and trading shares of their ventures in the 17th century, they borrowed the word because the logic was identical: here is a thing you can count, here is what it's worth, here is what you own. The London Stock Exchange is, etymologically, a very large cattle market.

    Yard with various animals — detail

    What You Actually Owned Was a Piece of the Hold

    "Shares" are even more literal. Merchant ships in the 16th and 17th centuries were ruinously expensive to fit out, and no single trader wanted to bear the whole risk of losing one to a storm off Lisbon. So several merchants would each take a share of the cargo – not a certificate, not a number on a ledger, but a physical portion of the hold. Your third of the spice shipment. My quarter of the cloth. If the ship made it home, everyone collected their portion of the profit. If it sank, everyone lost their slice together.

    That's still exactly what a share is. You own a fraction of everything the company contains, good and bad, profitable voyage or shipwreck.

    How did bear baiting give its name to falling markets?

    Here is where it gets properly interesting. In 18th-century London, Southwark and the streets around Exchange Alley were home to two things at once: animal-baiting (bears and bulls set on each other or on dogs, for entertainment) and the coffee houses where merchants and speculators gathered to trade. The same crowd, the same streets, the same afternoons.

    A "bear" came to mean a trader who sold something he didn't yet own, hoping to buy it back cheaper later – from the proverb about selling a bear's skin before you'd caught the bear. A "bull" was his opposite, charging in and buying on optimism alone. Bear market, bull market: still just those two animals from Southwark snarling at each other across the cobbles.

    For a different kind of hidden language sewn into everyday objects, The Tiny Technical Manual Sewn Into Your Clothes does a similar job with clothing labels.

    The Concrete World Inside the Jargon

    Every term a beginner finds baffling turns out to be a physical object from a few hundred years ago. A stock is still a yard full of countable animals. A share is still a portion of the cargo. A bull and a bear are still the same two creatures from the same grubby neighbourhood. The abstraction isn't mysterious – it's a fairly thin coat of paint over something you could have smelled, touched, and stepped around in your good shoes.

    Which makes the whole thing considerably less mystifying, and only slightly less chaotic.

    Questions this raises

    • Where does the term bull market actually come from?
    • What did the word broker originally mean?
  • The Market That Used to Have a Postcode

    The Market That Used to Have a Postcode

    When the evening news says "the stock market fell today", it sounds like they're talking about one thing. A place. A barometer. The stock market, singular, definite, London. But for most of Britain's industrial history, that sentence would have made about as much sense as saying "the football ground". There were dozens of them, scattered across every major city. The one in London wasn't even necessarily the most important one for your part of the country.

    The Manchester Stock Exchange opened in 1836. Liverpool had its own. So did Birmingham, Glasgow, Edinburgh, Leeds, Newcastle, Bristol. These weren't little imitation Londons, pale copies deferring to the capital – they were real markets with their own listed companies, their own trading floors, their own rhythms. Manchester's was shaped by cotton. Glasgow's reflected shipbuilding and heavy engineering. You could buy shares in a Clydeside yard or a Lancashire mill from people who understood those industries because they lived inside them, because the smog from those chimneys was the same smog they walked through on the way to work.

    Historic market street with postcode signage — detail

    The Ticker Tape Ran Both Ways

    This matters because stock exchanges don't just reflect an economy, they actively direct capital into it. When a company in Bradford wanted to expand, it could list on the Yorkshire exchange and raise money from local investors who knew the wool trade. People who had opinions about that particular firm. Who might even know the managing director. The geography of the exchange and the geography of the industry were the same geography.

    That local loop – money raised locally, invested locally, scrutinised by people with local knowledge – is exactly what consolidated away when the regional exchanges merged with, or were simply outlasted by, the London Stock Exchange through the 1960s and into the 1970s. The process wasn't violent or dramatic. Telephone dealing made physical trading floors less essential, commissions were standardised, and one by one the regional exchanges found that belonging to a national network made them redundant. Then the network swallowed them whole. By 1973, a single unified Stock Exchange stretched across what had been an archipelago of distinct, locally rooted institutions.

    The Map That Remains

    What changed wasn't just where the dealing happened. It was which companies could realistically get funded. A firm in Sheffield or Dundee now had to make its case to capital concentrated in the City of London. To investors whose mental map of British industry had London at its centre. Plenty of regional businesses still managed it, and still do. But the natural gravity of the system shifted, and the regional industrial economies that had nurtured their own exchanges didn't just lose a building. They lost a piece of financial infrastructure that had been built around them specifically.

    For The Ground Beneath Your Money, visit https://savingourplanet.co.uk/the-ground-beneath-your-money/

    None of this is ancient history in the way that people sometimes treat it. The singular "stock market" that British people grew up hearing about on the news – the number that goes up and down and supposedly tells you how the economy is feeling – is not some natural phenomenon. It's the survivor. The one that lasted. And when it goes up, it doesn't go up equally for everywhere.

    Questions this raises

    • When did the regional stock exchanges close?
    • Why did London absorb the Manchester and Liverpool markets?
    • How did local firms raise money after they went?
    • Are there any regional share markets left in Britain?